
Sarasota County & Charlotte County: March 2026 YOY
March is typically the month where the Southwest Florida real estate market starts telling us what kind of year we are going to have. The seasonal buyers are here, the listing pipeline has filled up, and the data starts reflecting real momentum rather than noise. This March told a very clear story, and it is one worth paying attention to whether you are thinking about buying, selling, or just trying to understand where things stand.
Across both Sarasota County and Charlotte County, the March 2026 numbers show a market that has meaningfully tightened compared to where we were a year ago. Closed sales are up. Inventory is down. New listings are declining. Pending sales are rising. These are not subtle shifts. This is a market that is rebalancing in a direction that favors sellers more than it did at this time last year, while still offering real opportunities for prepared buyers.
I break this report down across all residential property types, including single family homes, condos, townhomes, and manufactured housing, using year-over-year comparisons from March 2025 to March 2026. I also dig into city-level data for North Port, Venice, Sarasota, and Punta Gorda, because the countywide averages only tell part of the story. What is happening in North Port is not the same as what is happening in downtown Sarasota, and your strategy should reflect that.
Sarasota County: March 2026 at a Glance
Closed Sales: Real Demand, Not Just Activity
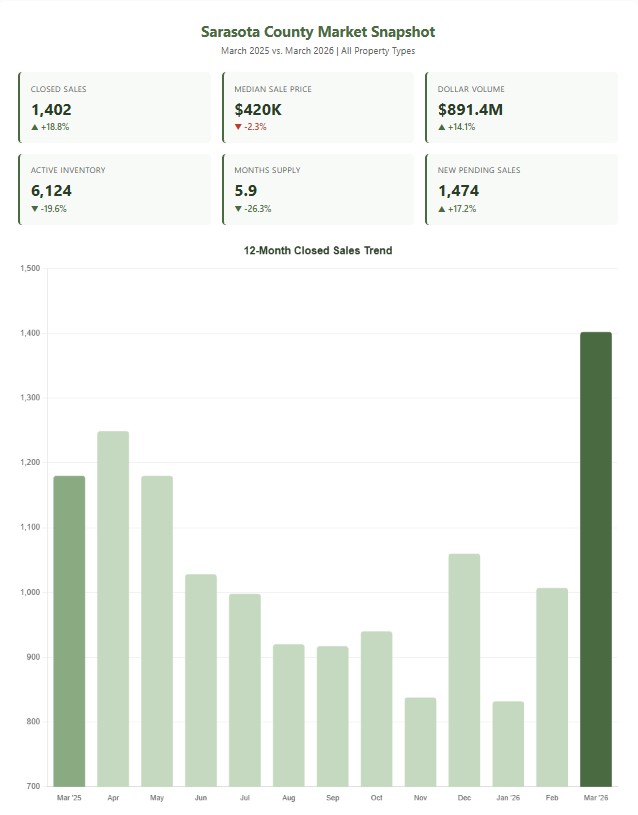
Sarasota County recorded 1,402 closed sales in March 2026, an 18.8% increase over the 1,180 closings in March 2025. That is not a minor uptick. That is a meaningful acceleration in transaction volume that signals genuine buyer confidence. Dollar volume followed suit, jumping 14.1% to $891.4 million for the month.
What makes this number even more interesting is the context around it. This increase happened while median prices were still slightly below where they were a year ago. That tells you something important: buyers are not sitting on the sidelines anymore. They are engaging with the market at current price levels, which is how real recoveries begin. You do not wait for prices to spike before buying. You buy when the market shows you that the bottom has stabilized and momentum is building.
Over half of those closed sales, 51.9%, were cash transactions. That percentage has been remarkably consistent throughout the past 12 months, hovering between 45% and 57%. The cash buyer presence in Sarasota County remains a structural feature of this market, driven by retirees, second home buyers, and relocators from higher-cost states who are bringing equity with them.
Median Sale Price: Stable, Not Falling
The Sarasota County median sale price came in at $420,000 in March 2026, down just 2.3% from $429,999 a year ago. That number has been bouncing between $386,500 and $420,000 for the past six months, which tells me we are in a range-bound pricing environment rather than a declining one.
If you look at the 12-month trend, March 2026 actually ties with December 2025 as the highest median price in the past year. That is significant because it suggests the floor has been established and prices are now consolidating rather than continuing to adjust downward.
The average sale price tells a similar story at $635,792, down 3.9% year-over-year but very close to the $633,687 recorded in February and the $633,804 in December. The luxury end of the market is pulling the average up relative to the median, which tells you that higher-end properties are transacting at healthy levels.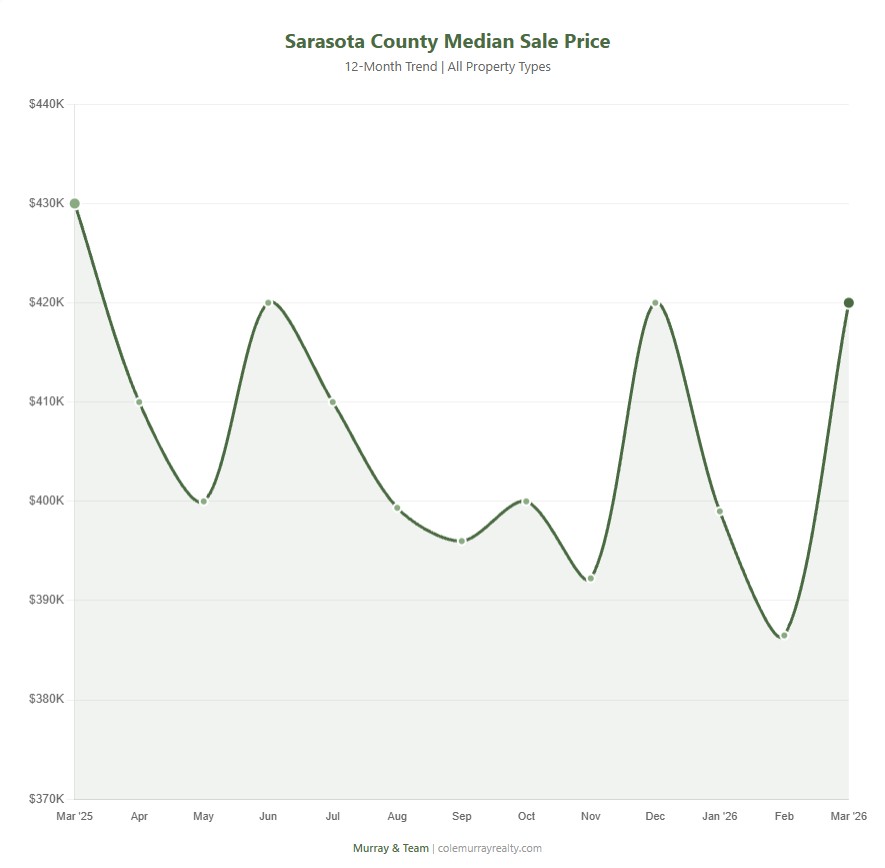
Inventory: The Story of the Spring
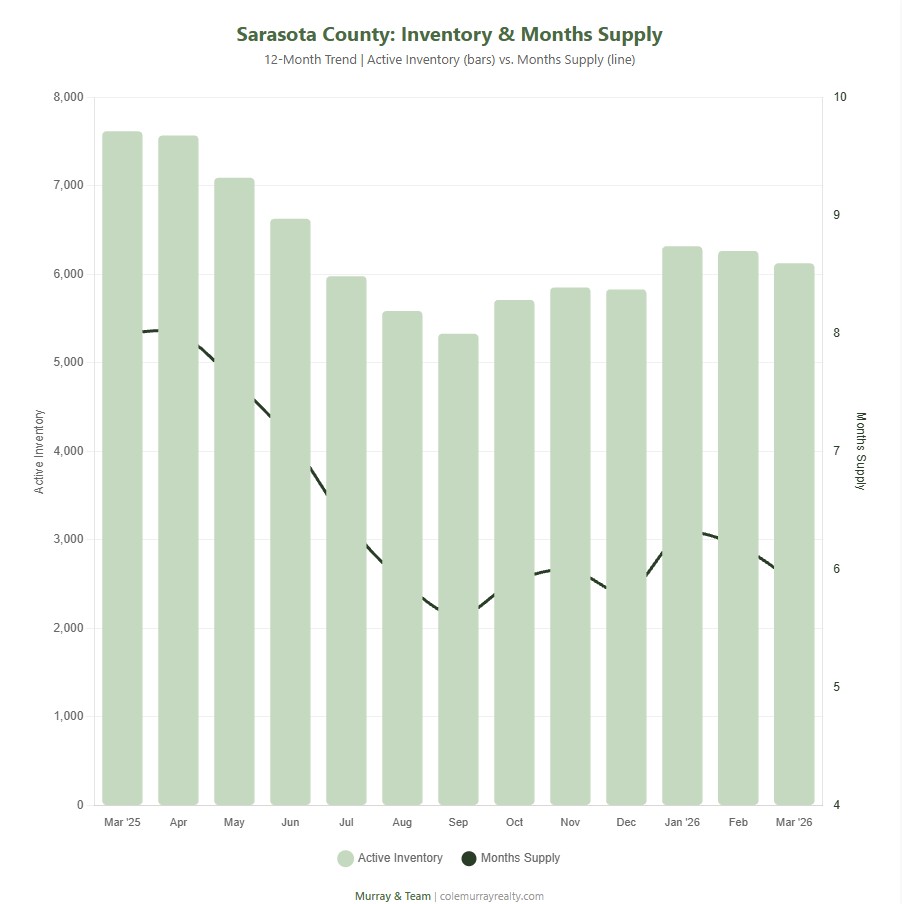
This is where the data gets really compelling. Active inventory in Sarasota County dropped to 6,124 homes in March 2026, a 19.6% decline from 7,614 a year ago. That is nearly 1,500 fewer homes on the market.
At the same time, months of supply fell from 8.0 to 5.9. To put that in context, anything between 5 and 7 months is generally considered a balanced market. Last March, at 8 months of supply, Sarasota was clearly buyer-favored. Today at 5.9 months, the market has shifted to balanced with a tilt back toward sellers.
What is driving the inventory decline? Two things working together: new listings dropped 16.8% (from 1,969 to 1,639), and absorption improved with new pending sales rising 17.2% (from 1,258 to 1,474). Fewer homes entering the market combined with more homes going under contract equals a tightening supply dynamic. This is the kind of shift that precedes price firming.
For sellers, this means less competition. For buyers, this means fewer options and less negotiating leverage than you had six months ago. Neither of those conclusions should be taken as good or bad in isolation. They are simply the reality of where we are, and your strategy should adjust accordingly.
Days on Market: Patience Still Required
The median time to contract in Sarasota County increased to 54 days, up from 42 days in March 2025. Median time to sale rose to 93 days from 83 days. These numbers tell you that while more homes are selling, the process is still slower than the frenzy years of 2021 and 2022. That is perfectly normal and healthy.
Buyers are doing their homework. They are evaluating insurance costs, ordering inspections, running the numbers on carrying costs, and negotiating. That is what you should expect in a cost-sensitive environment. Homes that are priced right from day one are beating the median by a wide margin. Homes that test the market with aspirational pricing are sitting 100+ days and eventually reducing.
If you are a seller wondering how to position your property to move within that competitive first two weeks, our 10 Steps to Sell Your Home guide breaks that strategy down in detail.
New Listings: Sellers Holding Back
New listings fell 16.8% in March, from 1,969 to 1,639. This is the rate lock-in effect still at work. Homeowners who locked in mortgage rates between 2.5% and 4% during 2020 through 2022 are reluctant to sell and take on a new mortgage at significantly higher rates. That reluctance suppresses supply and puts upward pressure on inventory dynamics even when demand is not red-hot.
This pattern has been consistent for over a year now, and I do not expect it to change unless mortgage rates drop meaningfully. The practical effect is that the market continues to absorb available inventory faster than it is being replaced. That is why months of supply keeps contracting despite a market that many people still describe as “slow.”
Charlotte County: March 2026 at a Glance
Closed Sales: Charlotte County’s Strongest Signal
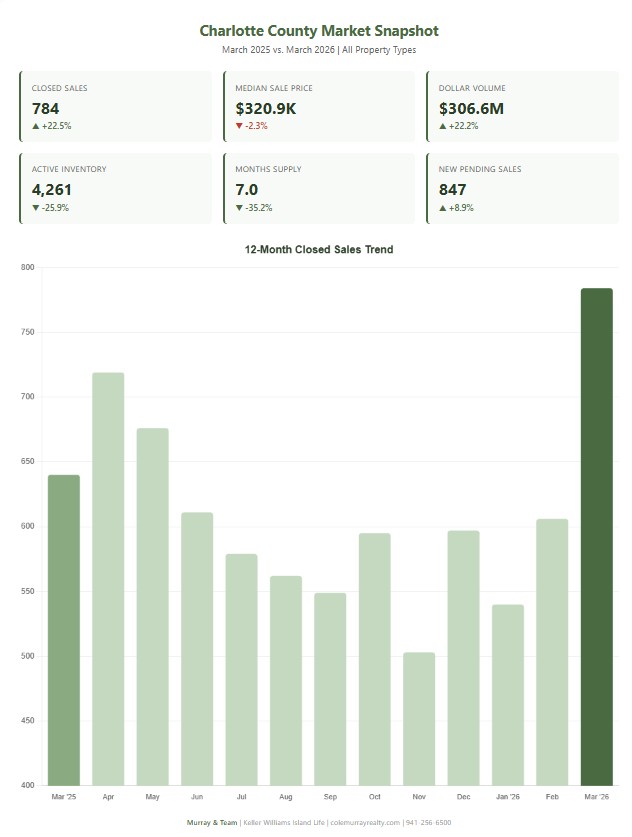
Charlotte County posted 784 closed sales in March 2026, a 22.5% increase over 640 closings in March 2025. This is the strongest year-over-year sales growth in our region, and it underscores something I have been saying for a while now: Charlotte County is where value-oriented buyers are going, and they are going in bigger numbers every month.
Dollar volume surged 22.2% to $306.6 million. Cash sales made up 52.3% of all closings, up slightly from 50.6% a year ago. The buyer profile in Charlotte County continues to be dominated by cash-ready purchasers, many of them retirees and second-home buyers relocating from higher-cost metros who are bringing equity and purchasing without a mortgage.
Areas like Port Charlotte, Punta Gorda, and Englewood continue to attract the bulk of this activity. If you are relocating from the Northeast, Midwest, or other high-cost states and want to maximize your purchasing power, Charlotte County deserves a hard look.
Median Sale Price: Flat is the New Up
The median sale price in Charlotte County was $320,900 in March 2026, down 2.3% from $328,500 a year ago. The average sale price was essentially flat at $391,020 versus $392,053. Both of these numbers tell you the same thing: pricing in Charlotte County has stabilized.
Looking at the 12-month trend, the median has ranged between $302,500 and $328,500, with March 2026 coming in at the higher end of that range. Just like Sarasota County, the pricing floor appears to be in place and we are now in a consolidation phase rather than a declining one.
Charlotte County’s median price remains roughly $100,000 below Sarasota County, which is why it continues to attract affordability-focused buyers. If you want to understand what your Charlotte County home is worth in this current market, request a free valuation here.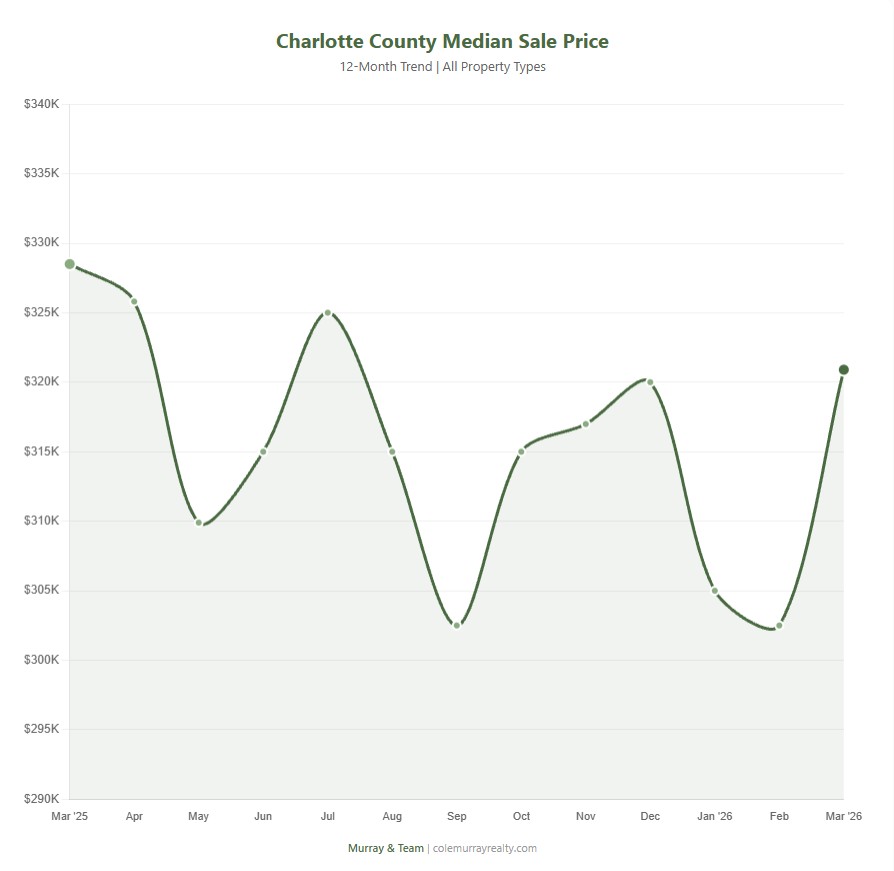
Inventory: The Biggest Shift in the Region
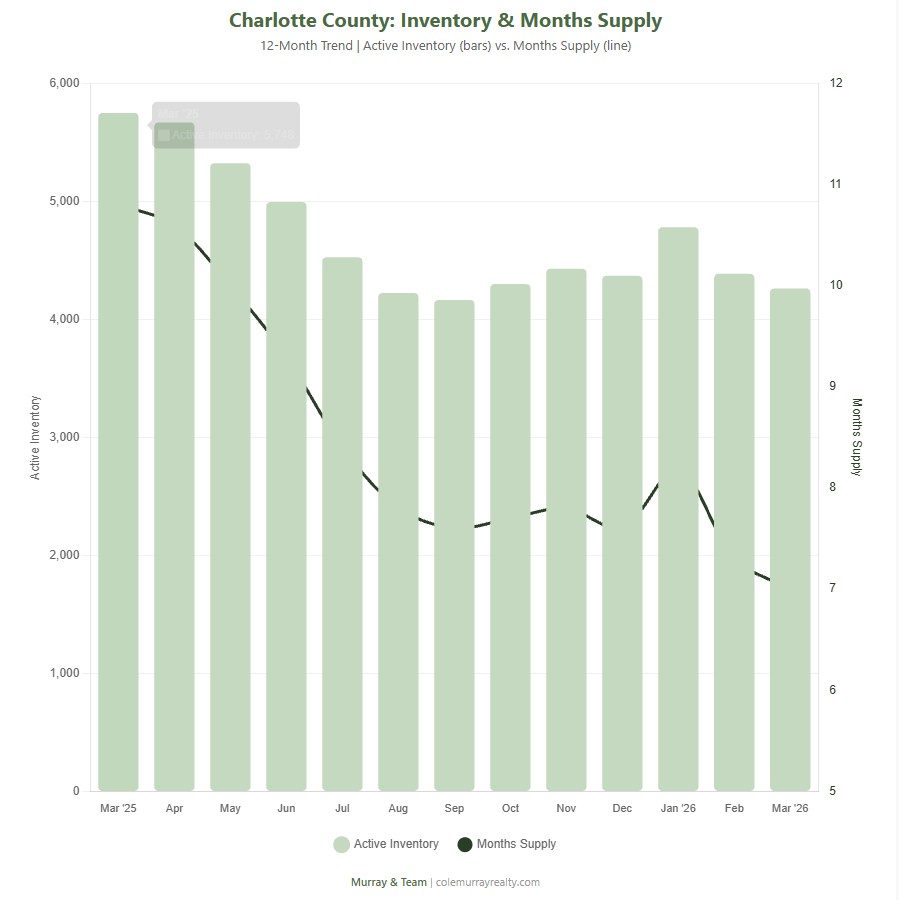
Charlotte County saw the most dramatic inventory contraction in the entire region. Active inventory dropped 25.9%, falling from 5,748 to 4,261. Months of supply plummeted from 10.8 to 7.0, a 35.2% decline.
To put this in perspective, last March Charlotte County was firmly in buyer territory at nearly 11 months of supply. Today at 7.0 months, it has moved into balanced territory. That is a massive shift in one year, and it happened because of the combination of 20.8% fewer new listings and 8.9% more pending sales.
If you are a seller in Charlotte County, this is the most favorable inventory environment you have seen in at least 18 months. Competition is down significantly, and buyers who are active in this market are serious. If you have been waiting for the right time to list, the data is moving in your direction.
Days on Market: Still a Patient Market
Median time to contract in Charlotte County was 77 days, up from 73 days. Median time to sale was 116 days, up from 109 days. Charlotte County has consistently shown longer marketing times than Sarasota County, and that pattern continues.
The longer timeline reflects the buyer profile in this market. Many Charlotte County buyers are making lifestyle moves rather than time-pressured job relocations. They are comparison shopping across multiple communities, evaluating insurance costs carefully, and taking the time to find the right fit. Sellers need to account for that in their expectations and pricing strategy.
One encouraging sign: the median percent of original list price improved from 91.1% to 92.3%. That means the gap between what sellers are asking and what buyers are willing to pay is narrowing. Sellers who are pricing within range of market value are getting closer to their asking price than they were a year ago.
City-Level Deep Dive: North Port
North Port continues to be one of the most active and affordable markets in Sarasota County, and the March 2026 data reinforces why so many buyers, especially families, first-time buyers, and relocators, are focused on this area.
| Metric | March 2025 | March 2026 | % Change |
|---|---|---|---|
| Closed Sales | 257 | 260 | +1.2% |
| Median Sale Price | $365,084 | $348,900 | -4.4% |
| New Pending Sales | 275 | 299 | +8.7% |
| New Listings | 361 | 325 | -10.0% |
| Active Inventory | 1,504 | 1,074 | -28.6% |
| Months Supply | 7.3 | 4.9 | -32.9% |
| Median Time to Sale | 101 Days | 100 Days | -1.0% |
| Cash Sales % | 37.7% | 39.6% | +5.0% |
The headline number for North Port is the months of supply: 4.9. That puts North Port closer to seller-favored territory than any other market segment we track. Active inventory has dropped 28.6% year-over-year, falling from 1,504 to just 1,074 homes. Meanwhile, new pending sales rose 8.7% and new listings declined 10%.
What this means practically is that North Port is tightening faster than the rest of Sarasota County. If you have been watching from the sidelines waiting for the “perfect” time to buy in communities like West Port, Wellen Park, or the established neighborhoods east of US-41, the window of maximum leverage is narrowing.
The median sale price of $348,900 is down 4.4% from $365,084 a year ago, but that number is likely to stabilize or firm up as inventory continues to tighten. Buyers are still getting value compared to peak pricing, but the days of sitting on a dozen options and picking the best deal are winding down in North Port faster than anywhere else in the county.
For sellers in North Port, this is the best supply-and-demand dynamic you have seen since early 2023. Less competition, steady buyer traffic, and prices that are holding rather than sliding. If you are thinking about selling, start with an accurate valuation and let’s talk strategy.
City-Level Deep Dive: Venice
Venice had an outstanding March, with closed sales jumping 30.2% year-over-year. That is the largest percentage increase among the four cities I track in this report, and it tells a story about renewed buyer confidence in one of the most desirable lifestyle markets in our area.
| Metric | March 2025 | March 2026 | % Change |
|---|---|---|---|
| Closed Sales | 96 | 125 | +30.2% |
| Median Sale Price | $432,450 | $440,000 | +1.7% |
| New Pending Sales | 100 | 101 | +1.0% |
| New Listings | 156 | 117 | -25.0% |
| Active Inventory | 661 | 464 | -29.8% |
| Months Supply | 9.3 | 6.1 | -34.4% |
| Median Time to Sale | 108 Days | 97 Days | -10.2% |
| Cash Sales % | 59.4% | 66.4% | +11.8% |
Venice is one of the few markets in our region where the median sale price is actually higher than a year ago, coming in at $440,000 versus $432,450 in March 2025. That 1.7% increase might seem small, but in a market where most areas are still seeing slight price declines, positive movement stands out.
What is driving Venice’s strength? Two things. First, inventory has dropped nearly 30%, from 661 to 464 active listings. Second, cash sales account for 66.4% of all transactions. That is the second-highest cash percentage among our tracked cities (behind Punta Gorda), and it tells you that Venice buyers are financially strong and not dependent on financing.
Months of supply fell from 9.3 to 6.1, moving Venice from buyer-favored into balanced territory. Meanwhile, median time to sale improved from 108 to 97 days, which means homes are moving faster. The median percent of original list price also improved from 90.2% to 92.6%, indicating tighter negotiations and better pricing alignment between buyers and sellers.
For buyers interested in the Venice lifestyle, whether that means island living, beach proximity, or one of the established golf communities, the Venice community page has current listings and market data. Venice also neighbors some excellent communities like Toscana Isles that are worth exploring.
City-Level Deep Dive: City of Sarasota
The City of Sarasota tells a different story than the rest of the county, and it is an important one to understand if you are considering buying or selling within city limits.
| Metric | March 2025 | March 2026 | % Change |
|---|---|---|---|
| Closed Sales | 120 | 132 | +10.0% |
| Median Sale Price | $558,750 | $711,500 | +27.3% |
| Average Sale Price | $1,252,020 | $1,141,564 | -8.8% |
| New Pending Sales | 119 | 175 | +47.1% |
| New Listings | 212 | 211 | -0.5% |
| Active Inventory | 905 | 947 | +4.6% |
| Months Supply | 9.4 | 11.0 | +17.0% |
| Median Time to Sale | 74 Days | 100 Days | +35.1% |
| Cash Sales % | 66.7% | 61.4% | -7.9% |
The median sale price jumped 27.3% to $711,500, which sounds dramatic until you consider two things. First, the City of Sarasota has a relatively small sample size (132 sales), so a few high-value closings can move the median significantly. Second, the average sale price actually declined 8.8% to $1,141,564, which tells you the ultra-luxury tier pulled back while the core middle-to-upper market strengthened.
The most notable data point for the City of Sarasota is the 11.0 months of supply. That is the highest among all our tracked markets, and it places Sarasota firmly in buyer-favored territory. Active inventory is up 4.6%, and while new pending sales surged 47.1%, there is still significantly more supply than demand relative to the pace of sales.
If you are a buyer looking at Sarasota proper, this is your market. You have leverage. There are options. You can negotiate. The flip side is that sellers in the city need to be exceptionally sharp on pricing, presentation, and marketing. There is too much competition to afford mistakes.
The 61.4% cash sales rate remains high but dropped from 66.7%, which may indicate that more financed buyers are entering this market segment. That is consistent with the pending sales surge and suggests broadening buyer participation.
City-Level Deep Dive: Punta Gorda
Punta Gorda had one of the most dynamic months in our entire tracking region. Closed sales surged 47%, from 66 to 97, while the median sale price jumped 14.8% to $544,000. Those are not incremental shifts. Those are signals that something real is happening in the Punta Gorda market.
| Metric | March 2025 | March 2026 | % Change |
|---|---|---|---|
| Closed Sales | 66 | 97 | +47.0% |
| Median Sale Price | $474,000 | $544,000 | +14.8% |
| New Pending Sales | 82 | 91 | +11.0% |
| New Listings | 121 | 81 | -33.1% |
| Active Inventory | 682 | 467 | -31.5% |
| Months Supply | 13.4 | 7.6 | -43.3% |
| Median Time to Sale | 108 Days | 129 Days | +19.4% |
| Cash Sales % | 59.1% | 70.1% | +18.6% |
The most striking transformation is in months of supply, which dropped from 13.4 to 7.6, a 43.3% decline. Last March, Punta Gorda was deeply buyer-favored with well over a year’s worth of inventory on the market. Today, that supply has been cut nearly in half. New listings dropped a staggering 33.1%, from 121 to just 81, which is the biggest new listing decline among all our tracked markets.
Cash sales at 70.1% are the highest of any city we track. Seven out of every ten sales in Punta Gorda are cash transactions. That buyer profile is heavily weighted toward retirees, second-home purchasers, and waterfront buyers who are bringing equity from previous home sales. If you are selling in the Punta Gorda Isles or Burnt Store Isles canal communities, your buyer is very likely paying cash.
The median time to sale of 129 days is the longest among our tracked cities, which reflects the higher price points and the more deliberate nature of the Punta Gorda buyer. These are not impulse purchases. People buying waterfront canal homes with Gulf access are taking their time, doing inspections, getting surveys done, and evaluating seawall conditions. That is normal and expected at this price tier.
Despite the longer marketing time, the 90.9% median list-to-sale ratio (up from 89.9%) tells you that sellers who are pricing within market range are getting closer to their asking price. The negotiation gap is tightening.
What Does This Data Mean for You?
If You Are Thinking About Buying
The window of maximum buyer leverage in most Southwest Florida markets is narrowing. Inventory is declining, pending sales are rising, and months of supply is contracting across the board. That does not mean you are too late, but it does mean you should not assume the market will give you more leverage three or six months from now. The trends are moving in the other direction.
The best positioning right now is to get pre-approved (or have proof of funds ready if you are paying cash), identify your target neighborhoods, and move decisively when the right property comes up. If you are relocating from out of state and want to understand the landscape before you arrive, our buyer resources page is a good starting point, and a phone call with our team can save you weeks of spinning your wheels on Zillow.
If you are financing, talk to your lender about interest rate buydown options. Seller-funded buydowns remain a common negotiation tool in this market and can meaningfully reduce your monthly payment for the first couple of years.
If You Are Thinking About Selling
This is the strongest seller environment we have seen in at least 18 months. Reduced inventory means less competition. Increased pending sales mean more buyer traffic. And while prices are not spiking, they are no longer declining, which means you can price with confidence rather than fear.
But none of that helps you if your home is overpriced, poorly presented, or marketed without strategy. The fundamentals have improved, but execution still matters. Start with an accurate home valuation, invest in professional photography, address any condition issues before you go to market, and price it to generate showings in the first two weeks. That playbook has not changed, and it is the one that consistently delivers results for my clients.
If You Are Watching and Waiting
Data is your best friend. Do not base your decisions on national headlines, social media opinions, or what your neighbor’s cousin thinks about the market. The numbers I just walked through are specific to Sarasota and Charlotte County, and they tell a different story than what you hear on cable news about the national housing market. Local data drives local decisions. Everything else is noise.
Frequently Asked Questions
Is the Sarasota County real estate market recovering in 2026?
Yes. March 2026 data shows strong recovery signals. Closed sales increased 18.8% year-over-year, new pending sales rose 17.2%, and active inventory dropped nearly 20%. While median prices remain slightly below March 2025 levels, transaction volume and buyer activity have strengthened meaningfully.
Are home prices going down in Charlotte County Florida?
Charlotte County median sale prices declined 2.3% year-over-year in March 2026, moving from $328,500 to $320,900. This reflects continued price normalization rather than market distress, as closed sales surged 22.5% and inventory dropped nearly 26% during the same period.
How long does it take to sell a house in Sarasota County in 2026?
The median time to sale in Sarasota County was 93 days in March 2026, up from 83 days a year earlier. Homes that are priced correctly from day one are selling faster than the median, while overpriced listings continue to sit longer and require price reductions.
Is North Port Florida a good place to buy a home in 2026?
North Port remains one of the strongest value markets in Sarasota County. The median sale price of $348,900 is well below the county average, active inventory dropped 28.6% year-over-year, and months of supply fell to 4.9, which is approaching seller-favored territory. Buyers looking for newer construction and affordability should give North Port serious consideration.
What is the median home price in Punta Gorda Florida?
The median sale price in Punta Gorda was $544,000 in March 2026, a 14.8% increase from $474,000 in March 2025. Punta Gorda’s market reflects its premium waterfront positioning and higher concentration of canal-front and Gulf-access properties.
Is it a buyer’s market or seller’s market in Southwest Florida in 2026?
It depends on the specific market. North Port at 4.9 months of supply is approaching seller-favored territory. Sarasota County overall sits at 5.9 months, which is balanced. Charlotte County at 7.0 months still leans slightly toward buyers. The City of Sarasota at 11.0 months remains firmly buyer-favored. Each city and neighborhood tells its own story.
How much are cash sales in Sarasota and Charlotte County?
Cash sales remain a dominant force in both counties. In March 2026, 51.9% of all closed sales in Sarasota County were cash transactions, and 52.3% in Charlotte County. In Punta Gorda specifically, 70.1% of closed sales were cash, reflecting the retiree and second-home buyer profile of that market.
Should I sell my home in Sarasota County in spring 2026?
Spring 2026 is showing improved conditions for sellers. Active inventory has dropped nearly 20% year-over-year, new listings are down 16.8%, and pending sales are up 17.2%. Sellers who price accurately and present their home well are positioned to benefit from reduced competition and increased buyer activity.
Ready to Make a Move?
At Murray & Team, we do not deal in generalities. We break down market data neighborhood by neighborhood, street by street, so you know exactly how to position your next move. Whether you are buying, selling, or just trying to understand where you stand, a conversation with our team is the best next step.
📞 Call/Text: 941-256-6500
✉️ Email: [email protected]
🌐 Visit: colemurrayrealty.com
Related Resources:
Get Your Free Home Valuation | Buyer Resources | Seller Resources | 10 Steps to Sell Your Home | How Interest Rate Buydowns Work | North Port Community Page | Venice Community Page | Punta Gorda Community Page | Port Charlotte Community Page
