

As we head into summer, the real estate landscape in Southwest Florida is showing a mix of activity across different cities. While inventory is shifting and prices are adjusting, the market continues to evolve in ways that matter to both buyers and sellers. Below, we break down the latest numbers from May 2025 and compare them from last month’s numbers, focusing on two key counties: Sarasota and Charlotte.
📍 Sarasota County: Cooling Slightly, but Still Competitive
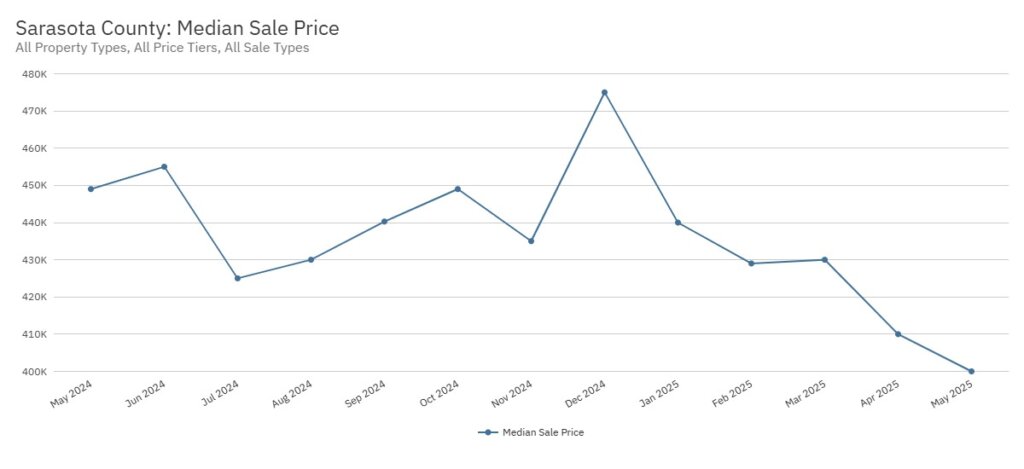
Sarasota County experienced a modest slowdown in overall activity this month, with closed sales down by 5.5% and median home prices dipping 2.4%. While prices remain strong historically, the increase in monthly inventory supply from 6.1 to 7.6 months suggests the market is continuing to shift in favor of buyers.
- Closed Sales: 1,249 → 1,180 (⬇️ 5.5%)
- Active Inventory: ⬇️ 6.3%
- New Listings: ⬆️ 20.7%
- Median Time to Sell: 95 → 97 days (⬆️ 2.0%)
- Monthly Inventory Supply: Increased from 6.1 to 7.6 months
- Median Sale Price: $410,000 → $400,000 (⬇️ 2.4%)
🏡 North Port
North Port is bucking the county-wide trend and remains a hotspot for buyer activity, with closed sales rising 10% and prices up 3.7%. Active inventory is tightening, while the number of new listings has dropped by 22%. These factors create more competition for buyers and slightly more favorable conditions for sellers, although we are still in a buyers market here. It is important to note that we should continue to monitor monthly stats here to identify a trendline more so than a single data point.
Closed Sales: 260 → 286 (⬆️ 10.0%)
- Median Sale Price: $328,000 → $340,000 (⬆️ 3.7%)
Active Inventory: ⬇️ 8.9% - New Listings: ⬇️ 22.0%
- Median Time to Sell: 97 → 104 days (⬆️ 7.0%)
- Monthly Inventory Supply: Decreased from 7.0 to 6.3 months
🏡 Venice
Venice saw the largest decline in closed sales in Sarasota County, down 22.3%, with a slight dip in pricing and inventory. Homes are taking significantly longer to sell, indicating waning buyer urgency and increased time on the market for sellers.
- Closed Sales: 94 → 73 (⬇️ 22.3%)
- Median Sale Price: $415,000 → $410,000 (⬇️ 1.2%)
- Active Inventory: ⬇️ 9.4%
- New Listings: ⬇️ 1.2%
- Median Time to Sell: 86 → 113 days (⬆️ 27.0%)
- Monthly Inventory Supply: Decreased from 9.1 to 8.5 months
🏡Lakewood Ranch
Lakewood Ranch had fewer sales this month, but the median time to sell dropped 40%, indicating that well-priced homes are moving faster, even as prices fell 12%. More new listings came online, and the inventory is holding steady.
📍Charlotte County: Slowing Market, Softer Prices
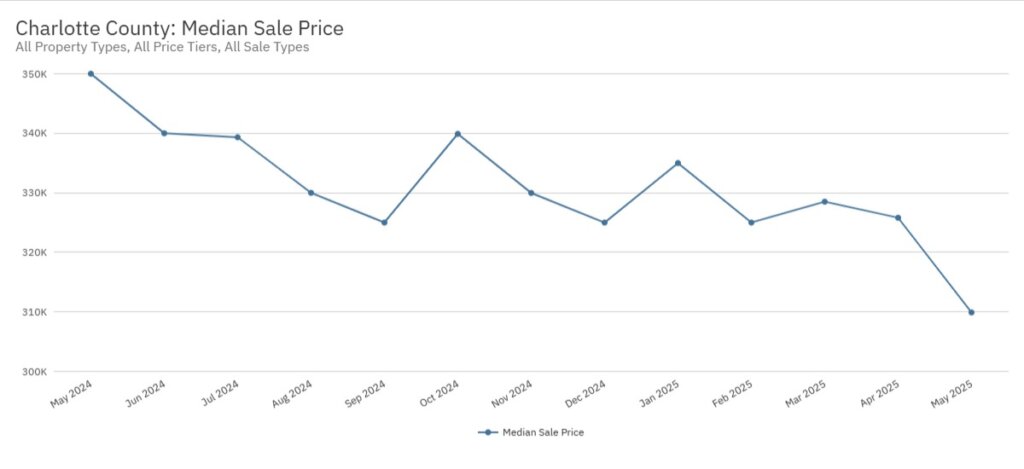
Charlotte County showed a cooling trend across most indicators, with closed sales down 6% and median sale prices dropping 4.9%. Inventory level stalled slightly, and homes are taking longer to sell, but this could present opportunities for buyers to negotiate sales price and concessions towards buyer’s closing costs.
- Closed Sales: 719 → 676 (⬇️ 6.0%)
- Active Inventory: ⬇️ 6.1%
- New Listings: ⬇️ 20.1%
- Median Time to Sell: 94 → 110 days (⬆️ 16.0%)
- Monthly Inventory Supply: Decreased slightly from 10.5 to 9.9 months
- Median Sale Price: $325,803 → $309,900 (⬇️ 4.9%)
🏡 Port Charlotte
Port Charlotte remains relatively stable, with sales up slightly (3.1%) and prices up nearly 3% MoM. Despite fewer new listings and lower inventory, the longer time on market could signal a slight shift in buyer behavior, possibly due to affordability concerns or seasonal slowdowns.
- Closed Sales: 160 → 165 (⬆️ 3.1%)
- Median Sale Price: $262,000 → $269,450 (⬆️ 2.8%)
- Active Inventory: ⬇️ 7.3%
- New Listings: ⬇️ 20.1%
- Median Time to Sell: 94 → 113 days (⬆️ 19.0%)
- Monthly Inventory Supply: Decreased from 7.6 to 7.1 months
🏡 Englewood
Englewood has a slight bump in closed sales (5.7%) but a significant 55.6% drop in new listings, which could put pressure on inventory in the coming months. Median sales prices declined by 5.1%, and homes are taking more than a month longer to sell—suggesting a cooling market with more cautious buyers.
- Closed Sales: 53 → 56 (⬆️ 5.7%)
Median Sale Price: $263,500 → $250,000 (⬇️ 5.1%) - Active Inventory: ⬇️ 12.9%
- New Listings: ⬇️ 55.6%
- Median Time to Sell: 82 → 115 days (⬆️ 33.0%)
- Monthly Inventory Supply: Decreased from 12.6 to 10.5 months
💡Key Takeaways for Buyers and Sellers
- For Buyers: With inventory still relatively high and prices softening in some areas, now may be a good time to negotiate—especially in Charlotte County or slower cities like Venice and Englewood.
- For Sellers: North Port and Port Charlotte are still showing consistent demand, but accurate pricing and proper home preparation are essential as buyers become more selective.
- For Everyone: While the market isn’t as frantic as it was in recent years, it’s still active. Local trends vary by city, so make decisions based on your specific neighborhood data and goals.
📲Thinking about making a move in Southwest Florida? Whether you’re considering buying or selling, or just exploring your options, let’s talk. With deep local insight and a pulse on today’s shifting market, our team is here to help you navigate the process with confidence—and find the right home at the right time.

